
By Neil Tiley, Senior Director at Pegasus Group
Summary:
- Pegasus analysis shows councils consistently overestimate “deliverable” housing: 30% more homes planned than built during 2019–24, and 21% more during 2020–25.
- The NPPF’s “realistic prospect” test for deliverable sites remains loose, especially for smaller sites with no hard evidence required.
- Most councils (around two-thirds) overestimate by at least 10%; mean overestimation is 29–41% across the periods studied.
- Key drivers: weak definition of “deliverable”, a self-reinforcing pipeline that blocks windfall sites, and optimistic land promoter inputs.
- Recommendations: A standardised national reporting format, a tighter deliverability test, larger buffers, and policy consequences for chronic overestimation.
The UK needs more homes, and this is at least in part to be provided for by the requirement for local authorities to maintain a sufficient supply of deliverable sites. But what if a proportion of those houses never get built? Is the number of homes being delivered reflective of the number being promised?
This is the question our team at Pegasus Group sought to answer. Our analysis reveals that while there are indeed a great deal of planned homes nationally, the deliverable supply often overestimates how many of those homes are actually delivered.
One of the tools in the planning system meant to deliver more homes is the five-year housing land supply (5YLS). It’s a rule requiring every council to show it has enough sites lined up to deliver five years’ worth of homes. In practice, however, the definition of ‘deliverable’ remains murky and there are steps the Government may wish to take to change this.
A brief history of the inconsistent definition of ‘deliverable’ housing
National policy requires councils to identify enough ‘deliverable’ housing sites for the next five years, plus a buffer of either 5% or 20% depending on the historic record of delivery.
The problem has always been defining what’s ‘deliverable.’ The NPPF of 2012 said sites needed a ‘realistic prospect’ of delivery within five years but didn’t explain what ‘realistic’ actually meant. This left it to courts (see Wainhomes Judgment) who found that what represented a realistic prospect fell to a matter of planning judgment, such that a realistic prospect was interpreted differently by different decision makers. Some counted sites with very slim odds as ‘realistic’ while others set a much higher bar.
The NPPF 2018 tried to fix this inconsistency, with the requirement for clear evidence that homes will actually be built on large or allocated sites. One would expect that this revised definition, which remains part of current national policy, resulted in the deliverable supply being more realistic than it previously was. Notwithstanding this, the analysis suggests that we continue to rely upon far more homes being built than actually are.
What does Pegasus’ analysis reveal about deliverable housing supply? In short, supply figures are inflated
We reviewed historic assessments of the deliverable supply prepared by Local Planning Authorities (LPA) using the revised definition across two timeframes: 2019 to 2024, and 2020 to 2025. Using these assessments, we compared what councils identified as being deliverable versus what was actually built across hundreds of councils in England.
In short, we found a significant gap. Between 2019 and 2024, 594,551 homes were planned across 118 LPAs for which the data was consistently available, but only 457,809 were built – 30% more homes promised than built.
The story is similar over the 2020 to 2025 period, where 557,397 homes were forecasted across 113 LPAs but only 459,961 delivered – 21% more promised than delivered homes.
While this story isn’t consistent across every LPA, this is far from a couple of councils having a bad run. The vast majority of councils – 67% and 66% of LPAs for each timeframe, respectively – identified at least 10% more homes in their deliverable supply than the number that was delivered.
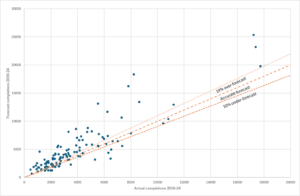

Indeed, the mean level of overestimation in each LPA was 41% for 2019-2024 and 29% for 2020-2025. The median level of overestimation was 28% for 2019-2024 and 22% for 2020-2025.
In some more extreme cases, we found outliers where more than twice as many homes were forecast than actually delivered.

Why are councils overestimating housing supply?
There are a few reasons why this overestimation is happening.
- The bar for ‘deliverable’ remains very low: The definition of a ‘deliverable’ site still only requires that there be a realistic prospect of delivery within five years on smaller sites or sites with detailed consent, but this remains a loose definition. There is no requirement for hard evidence on smaller sites, which leaves plenty of room for over-estimation.
- The chicken and egg problem of a vicious cycle: If a council has a big and healthy-looking pipeline of planned houses, it’s harder for new sites to secure planning permission. This can lead to the unintended consequence of even greater overestimation – i.e. it becomes more difficult to gain planning permission for “windfall” developments that could help maintain the supply.
- Macro-economic factors are also playing a role: During many of these LPA assessments, the world was still in the grips of the pandemic, so it’s only logical that the LPAs would have underestimated supply, given the relatively rapid recovery from the pandemic. In reality, the opposite proved to be true.
- It’s not because of landbanking: This is a common accusation but one that has been debunked repeatedly over the years. The evidence simply doesn’t show that developers are deliberately sitting on land to control supply.
- It’s in everyone’s self-interest to be hopeful: Land promoters are naturally inclined to overstate the contribution their site will make to the deliverable supply, as set out in countless appeal decisions.
It is worth noting that a smaller number of councils have actually underestimated supply: 14% and 16% underestimated by 10% or more in their respective periods. Much of this can be attributed to new local plans coming in and unlocking more development than expected. But these cases are the exception, not the rule.
Does the NPPF make any material changes to how housing need and housing land supply should be assessed?
Housing need and supply policies
Annex D of the NPPF outlines how housing needs and housing land supply should be assessed. This remains substantively unchanged from the former NPPF of 2024:
- The standard method for assessing the minimum local housing need remains unchanged;
- The consequences of the Housing Delivery Test remain unchanged’
- Also unchanged is the annual requirement to identify and update a supply of specific deliverable sites that provide at least five years’ worth of homes. That supply is measured against adopted housing requirements adopted in the last five years, or otherwise against the minimum local housing need of the standard method.
There is, however, one material change in the way the deliverable supply is to be calculated.
Under the former NPPF, whilst paragraph 78 required sufficient specific deliverable sites to be identified, paragraph 75 made an allowance for non-specific windfall sites. In this context, it was commonly understood that such a windfall allowance could be included in the supply of specific deliverable sites needed under paragraph 78, notwithstanding the fact that these were not specific sites.
The new NPPF addresses this ambiguity by identifying separate policies that apply to plan-making and decision-making, while also stating that a windfall allowance can only be used for plan-making purposes. This means the deliverable supply used for decision-making must not include any windfall allowance.
Consequently, the deliverable supply – and therefore the five-year land supply positions of many LPAs – will be materially lower than that identified under the former NPPF, owing to removal of the windfall allowance.
The exclusion of a windfall allowance should mean that the forecast supply is closer to the actual number of homes that are delivered.
Will the removal of the windfall allowance be sufficient?
Currently, there’s no consistent national method for how the deliverable supply is presented.
This is something the Government should consider standardising, by requiring every council to report its housing supply figures to the MHCLG in a standard format annually.
This would allow the Government to monitor and take action if there continues to be a significant disparity between the forecast supply and the actual number of homes delivered going forward,
Assuming that there continues to be significant levels of overestimation, the Government may wish to revise the national policy. The changes could include:
- Revise the definition of a deliverable site to require some degree of confidence in the deliverability of all sites.
- Increase the buffer that councils are required to build into their forecasts to better account for the homes that won’t materialise.
- Introduce a policy consequence for overestimation, which would serve to ensure that the deliverable supply is more realistic at the time it is assessed.
If you’d like to discuss how Pegasus can support your development, get in touch with Neil Tiley.
